Bar Chart Widget
A Bar chart widget based on the g2plot library.
Usage
Allows displaying of category data with one or more series (bars) on the y axis. The value in XAxisField must be a unique string or number. The XAxisFormat can be used to format the way the category is displayed on the chart.
Properties
| Property | Type | Binding | Default | Description |
|---|---|---|---|---|
| Template | STRING | < | Template1 | Template used for the widget styling. |
| Orientation1 | STRING | Vertical | Sets the orientation of the Bar Chart. | |
| DataGrouping2 | STRING | < | none | Sets the way same category values will be grouped. |
| ReflectXAxis | BOOLEAN | false | Invert Bars along X Axis. | |
| ReflectYAxis | BOOLEAN | false | Invert Bars along Y Axis. | |
| GlobalProperties | JSON | < | A serialized JSON object that has global parameter names as its keys and data types as values. These are properties can be referenced when using expression formatting | |
| Data | INFOTABLE | < | Chart data source. | |
| DataFormat3 | STRING | none | Wide Table | Defines how the format of the 'Data' property. See the section below for more information. |
| XAxisField | FIELDNAME | Name of the column in the Data infotable containing the values of the X axis. | ||
| YAxisFields4 | STRING | < | A comma separated string representing the name of the data fields corresponding to the graph in the y direction, usually the fields corresponding to the vertical coordinate axis. | |
| XAxisFormat | STRING(localized) | Localizable token in order to format the values of the X axis. See Formatting ._ | ||
| YAxisFormat | STRING(localized) | Localizable token in order to format the values of the Y axis label. (It will not format the values displayed in the tooltip, see YAxisFormats for that) | ||
| StackedGroupedType | FIELDNAME | The name of the data field corresponding to the type used to join values into stack when using stackedGrouped DataGrouping. Property hidden - Shown only when DataGrouping is set to true | ||
| ValueNameField | FIELDNAME | When DataFormat is set to tallTable, describes the name of the field containing the value name. | ||
| TooltipFormats4 | STRING(localized) | < | Localizable tokens specified in a CSV format in order to format the values of the Y axis that are displayed on the chart's tooltip. | |
| CategoryLabels | STRING(localized) | < | A comma separated string representing the user facing names of the fields in YAxisFields. The items should be in the same order. | |
| XAxisTitle | STRING(localized) | < | Localizable token for X Axis Title. | |
| YAxisTitle | STRING(localized) | < | Localizable token for y Axis Title. | |
| SelectionMode5 | STRING | none | Allows specifying is selection is enabled within the chart. | |
| SelectedData | INFOTABLE | > | An infotable describing the currently selected "Cells" in the bar chart. Infotable with fields x, y, dataField. Enables use-cases where the user can select a specific cell, in order to drill down into data | |
| Annotations | INFOTABLE | < | Annotations data source. | |
| AnnotationTimestampField | FIELDNAME | Name of the column in the Annotations infotable containing the annotation's timestamp value, used for determining where to place the annotation on the X axis. | ||
| AnnotationYField | FIELDNAME | Name of the column in the Annotations infotable containing the annotation's Y value, used for determining where to place the annotation on the Y axis. | ||
| AnnotationIconField | FIELDNAME | Name of the column in the Annotations infotable containing the IQNOX icon URI, used for determining how the annotation is rendered. | ||
| AnnotationDescriptionField | FIELDNAME | Name of the column in the Annotations infotable containing annotation's description, used for displaying additional information when hovering on the icon. If it is not provided, the annotation will not show any description on hover. | ||
| AnnotationColorField | FIELDNAME | Name of the column in the Annotations infotable containing annotation's color, used for controlling which color the icon font is rendered with. If it is not provided for an annotation, the chart will fall back to displaying it in the color selected in the template configuration. |
Events
| Property | Type | Binding | Description |
|---|---|---|---|
| SelectionChanged | EVENT | > | Triggers with the selection inside the widget has changed, after the selection has propagated to other widget and the SelectedData property has been updated |
| DoubleClicked | EVENT | > | Triggered when the user double-clicks on a cell |
Expression Format context
When using Expression Format, other relevant fields can also be referenced.
value: STRING | NUMBER | DATETIME - To be applied on the XAxis field
globalCtx: TWJSON - Any TWX value declared on the widget Global Properties and that has a value bound.
ctx: { data: INFOTABLE (entire dataset) } - Access to the entire dataset bound to the Bar Chart.
Thresholds
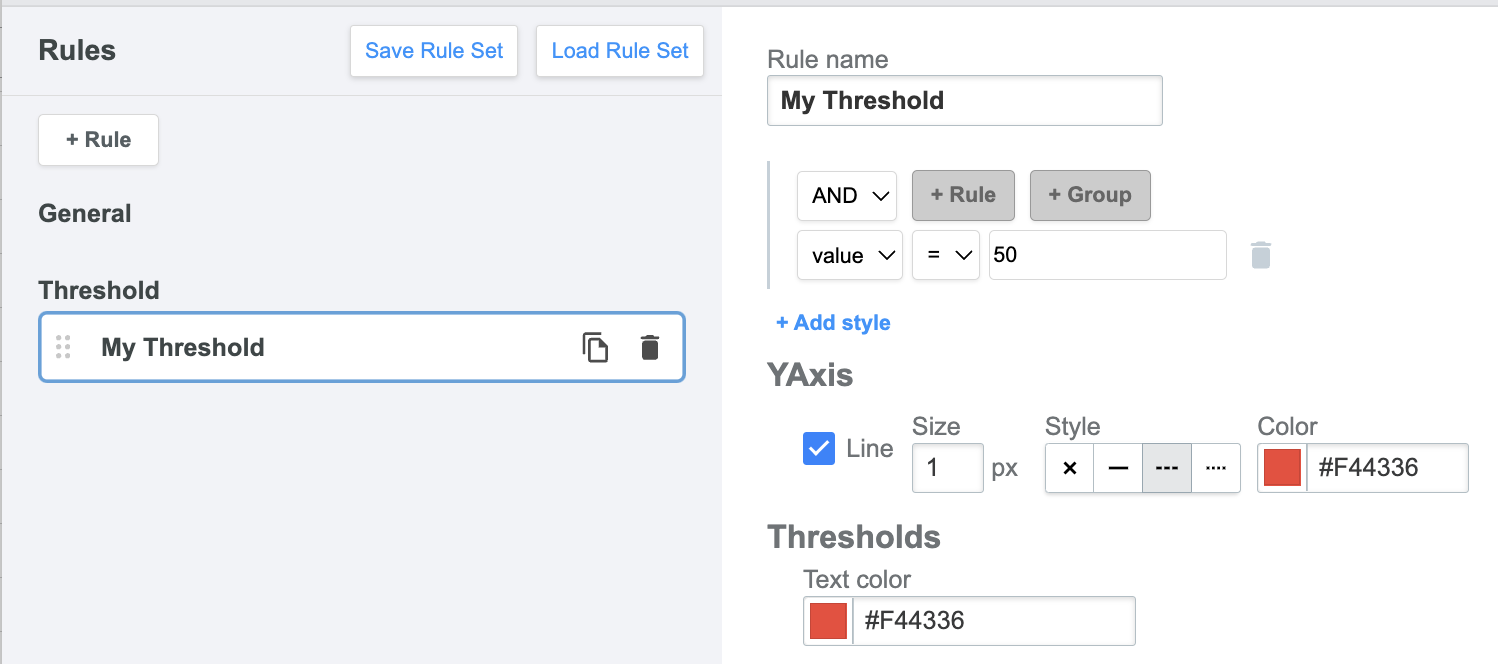
A threshold in the context of bar chart is a predefined reference value used to highlight specific data points that meet certain conditions. These thresholds help emphasize important values and provide a visual distinction between data points above and below a defined threshold.
The threshold can be set from the widget state formatter on the Threshold context by adding a rule with a limit value. A horizontal line can be drawn across the bar chart to visually indicate the threshold value. The line can be set by clicking the Add style button amd selecting the Line option, also you can change the color of the threshold text which will be the name set for the rule.
Example
- Settings:
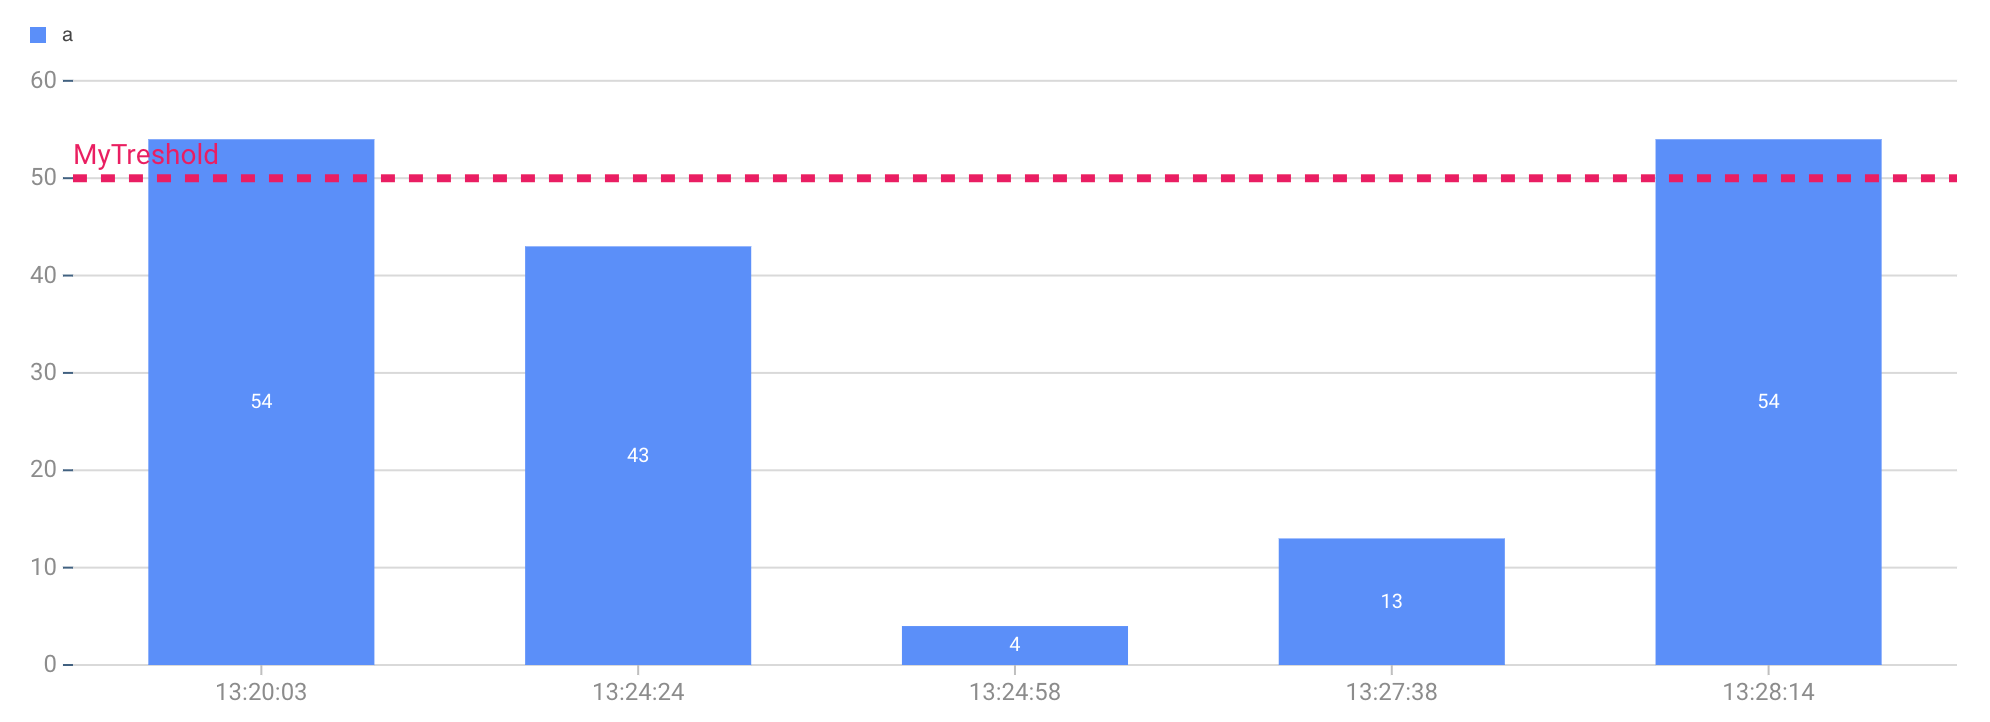
- Result
Footnotes
-
Orientation can have the following values:
Horizontal,Vertical↩ -
DataGrouping can have the following values:
None,Grouped,Stacked,Stacked Grouped↩ -
DataFormat can have the following values:
Wide Table,Sparse Wide Table,Tall Table.- 'Wide Table': Each row represents a full entity, with different attributes or measurements stored in separate columns.
- 'Sparse Wide Table': Similar to a wide table, but each row typically records only one non-empty attribute, leaving the others blank.
- 'Tall Table': Each row represents a single attribute-value pair for an entity, resulting in a longer, narrower format.
Example of the different formats:
Wide Table:
Entity Attribute A Attribute B Item 1 10 20 Item 2 30 40 Chart configuration:
DataFormat:Wide TableXAxisField:EntityYAxisFields:Attribute A, Attribute B
Sparse Wide Table:
Entity Attribute A Attribute B Item 1 10 Item 1 20 Item 2 30 Item 2 40 Chart configuration:
DataFormat:Sparse Wide TableXAxisField:EntityYAxisFields:Attribute A, Attribute B
Tall Table:
Entity Attribute Value Item 1 Attribute A 10 Item 1 Attribute B 20 Item 2 Attribute A 30 Item 2 Attribute B 40 Chart configuration:
DataFormat:Tall TableXAxisField:EntityYAxisFields:ValueValueNameField:Attribute
Note that in this mode, the
YAxisFieldsproperty can only have a single value, which is the name of the field containing the attribute names. TheValueNameFieldproperty is used to specify the name of the field containing the values. The bar chart will determine the Y axis field values by identifying the unique values in theValueNameFieldcolumn of the data table (ordered alphabetically). If these values are known in advance, theCategoryLabelsproperty can be used to specify the display names for these values. The order of the labels inCategoryLabelsshould match the order of the values in theValueNameFieldcolumn. ↩ -
The YAxisFields property is a comma-separated list of the names of the data fields for the Y axis. The TooltipFormats property is also a comma-separated list, containing localization tokens to format the corresponding fields in YAxisFields. For example, if
YAxisFieldsisa, b, candTooltipFormatsis[[f1]], [[f2]], [[f3]], then[[f1]]will format fielda,[[f2]]will format fieldb, and[[f3]]will format fieldc. ↩ ↩2 -
SelectionMode can have the following values:
None,Single,Multiple↩